 |
| Recent Articles |
SOA And Web 2.0
After a short break we had Sandy Carter on The New Language of Business - SOA and Web 2.0. Sandy has recently published a book on this topic (The New Language of Business: SOA & Web 2.0). IBM ...
Social Graph API From Google
Google just released the Social Graph API. Brad Fitzpatrick* in a blog post explains that Google crawls publicly available social network data in the form of XFN (XHTML Friends Network) or FOAF (Friend...
Multi-Tenancy Insight From Salesforce
Below Peter Coffee, Ddirector of Platform Research, salesforce.com, helps to explain multi-tenancy, how it is an enabler for effective cloud computing, and...
From The SOA Consortium - CIO SOA Concerns
Next up was a panel of experts - Sandy Carter of IBM, Judith Hurwitz of Hurwitz & Associates, Richard Soley of OMG - moderated by Brenda Michelson. This will apparently be available as a podcast some time...
WebGeo's Big Score In Amazon's Web Services...
Kudos to the crew at WeoGeo for scoring a big win as a finalist in the Amazon AWS Start-Up Challenge. WeoGeo creates a one-stop marketplace for mapping using Amazon EC2 and Amazon S3. WeoGeo supplies...
Keep Web Services Simple
The easy way for .NET developers to create an API over HTTP is to use SOAP web services. It's natively supported by .NET and has rich support for more complex data types such as the DataSet. The problem with SOAP...
|
| 03.27.08
Google Analytics Benchmarking Service
 By Rich Brooks By Rich Brooks
How do you compare to other Web sites in your industry?
It's fun and informative to review your Google Analytics reports to see how your Web site is fairing. Whether your traffic is going up or down, how people are finding you, what search terms they may be using, what your conversion rate is, etc. But a common question I'm often asked is "how do I compare to other nursing homes/psychologists/furniture makers?"
Until recently I've responded, "ummm...is that car on fire?" and then run away when they turned their head.
But now, Google Analytics, the free traffic reporting system from Google is offering benchmarking data so you can compare your results within your industry. The only cost...your soul!
Actually, just your data. And it's supposedly shared anonymously. (And if you can't trust a giant corporate with the motto "Don't Be Evil", who can you trust?)
Here's how you set up Benchmarking in Google Analytics:
Get a Google Analytics account up and running.
Click on "Edit Account and Data Sharing Settings" from the Google Analytics home page.
Choose "Share my Google Analytics data..." and then check off "Anonymously with Google products and the benchmarking service." Save changes.
Once that's done you can log into the Web site's analytics you want to benchmark. Under Visitors you'll now find Benchmarking (beta).
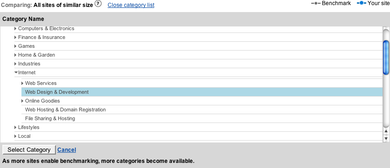
First step is to choose your industry:

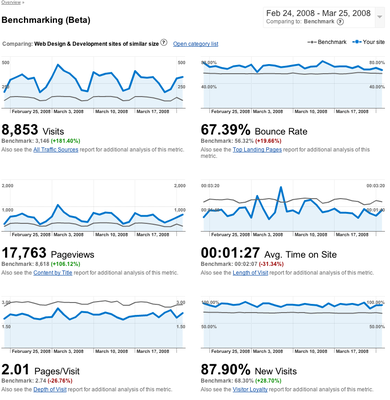
Once you do that you'll see the benchmarking results for a number of reports Google is including in this beta version. (I'm guessing they'll add more later on.)

Continue reading this article.
About the Author:
Rich Brooks is president of flyte new media, a Web site design and Internet marketing company in Portland, Maine. Flyte works with small businesses to build professional Web sites that often include e-commerce, Flash and content management systems. They promote their clients' sites through search engine optimization, e-mail marketing, business blogs and podcasts, and viral marketing. |


 By Rich Brooks


0 comments:
Post a Comment